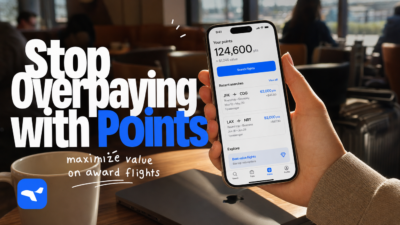
Airline pricing may look mysterious from the outside. One day you might see that a flight costs 12,500 miles. The next day it costs 42,000. At the same time, another airline might charge 70,000 for the same route. Meanwhile, cash fares move in completely differently. Does this make you question the credibility of airline award pricing?

This guide will give an in depth explanation on how airline pricing actually works behind the scenes–including fare buckets, saver inventory, dynamic pricing, partner access, and how ecosystems influence pricing decisions.
Understanding how award pricing works is the difference between redeeming efficiently and burning miles at poor value.
Quick Summary of this Article
- Airline award pricing is primarily driven by revenue management systems and they are not fixed mileage charts.
- Most airlines now use dynamic pricing, where mileage costs fluctuate based on demand and booking trends.
- Saver awards exists but they are limited.
- Timing impacts both availability and the number of miles required.
- Partner awards typically follow more stable chart-based pricing and require saver availability.
- Mileage prices reflect what the airline expects to earn if the seat were sold for cash.
- Understanding pricing mechanics helps travelers identify high-value redemptions and avoid inflated pricing.
Part 1: What an Award Seat Really Is
An award seat is not a “free seat”. It is an inventory that the airline has decided to make available in a specific booking class that can be purchased with miles.

Airlines divide seats into booking classes called fare buckets that determine pricing rules and availability. There are two primary categories:
- Revenue fare buckets (cash tickets)
- Award fare buckets (mileage tickets)
Award buckets are separate from revenue buckets. So, even if cash tickets are available, award seats may be zero. This separation is fundamental.
Refer to our latest blog to understand why empty seats don’t mean award seats.
Revenue Fare Buckets Explained
Every seat belongs to a booking class. There are letter codes that represent each pricing tiers. They don’t represent a certain quality. Just rules and restrictions. Here’s a simplified view of some common revenue buckets on US carriers:
| Cabin | Full Fare | Discounted | Deep Discount |
| Economy | Y,B | M,H,Q | V,K,L,G |
| Premium Economy | W | E | – |
| Business | J | C,D | P |
| First | F | A | – |
Revenue management systems adjust how many seats are available in each bucket based on demand forecasts. For example, if demand spikes, cheaper buckets close and only higher buckets remain available.
Award Fare Buckets Explained
Award tickets are drawn from separate inventory classes. A few airline examples:
| Airline | Economy Saver | Business Saver | First Saver |
| United Airlines | X | I | O |
| American Airlines | T | U | Z (international) |
| Delta Air Lines | X (rare saver) | Z | 0 |
| Alaska Airlines | X | I | – |
It does not matter how many economy seats are unsold in revenue buckets. If X=0, there is no saver economy.
Part 2: How Revenue Management System Determines Pricing
Airlines don’t simply put a fixed price on tickets. They use sophisticated revenue management systems that forecast demand of flight tickets using:
- Historical booking data
- Seasonal trends
- Competitor pricing
- Corporate contracts
- Booking curve behaviour
- Load factor targets
With this data, airlines simply change the pricing at every chance it can create more profit. The airline goal is simple: maximize total revenue per flight. Miles complicate this system because they represent financial liabilities. To put it clearly:
When airlines issue miles (especially through credit card partnerships), they receive cash upfront. But those miles represent future transportation obligations. Award seats allow airlines to reduce this liability. But it is only when it does not interfere with profitable cash sales.
Business-heavy routes rarely release award seats because they already have strong demand. Airlines earn huge profits even on last-minute bookings through corporate contracts. This is why award space feels scarce in premium routes.
Loyalty Programs as Financial Assets
Loyalty programs are extremely profitable for airlines. Banks buy miles in bulks at negotiated rates (roughly around 1-1.5 cents per mile). This generates immediate cash flow for airlines.
For example:
- Delta Air Lines generates billions annually through its partnership with American Express.
- Likewise, United Airlines partners with Chase.
- American Airlines partners with Citi and Barclays and creates huge profit.
Well, this is the profit part. But how does this affect pricing?
Answer: Issuing too many miles creates inflation. More miles chasing limited award seats leads to devaluation. This is where it affects pricing.
The response (partly) to this situation is “dynamic pricing”.
Part 3: Saver Awards vs Dynamic Pricing
Historically, airlines used fixed award charts. But that era has largely ended for US carriers. Saver and dynamic awards represent two complementary strategies airlines use to balance loyalty rewards with revenue maximization.
Saver Awards
Saver awards are tied to specific award buckets (X,I,T,U, etc)
Key features:
- Priced at fixed low mileage
- Have limited quantity
- Often follow semi-predictable pricing
- Visible to partner airlines
- Offer highest redemption value
Dynamic Pricing
Dynamic pricing adjusts mileage costs based on:
- Cash fares
- Projected demand
- Load factors
- Competitive pricing
Also read: Fixed vs Dynamic Award Pricing: How Award Costs Really Work
Here’s a quick comparison for you to understand the pricing differences of saver and dynamic pricing:
| Feature | Saver Awards | Dynamic Awards |
| Predictable price | Often | Rarely |
| Limited quantity | Yes | No strict cap |
| Partner access | Yes | Usually no |
| Value potential | High | Variable |
As of 2026 US legacy carriers award pricing is as follows:
- Delta Air Lines uses aggressive dynamic pricing.
- United Airlines removed its award chart for its own flights.
- American Airlines uses dynamic pricing for its own flights but keeps semi-fixed partner charts.
Part 4: Married Segment Logic and Pricing
Another pricing technique airlines use is the married segment logic. It is an advanced inventory control tool. To put it simply, married segment logic means:
‘Award availability depends on combined segments rather than individual segments’.
Which means, this pricing technique bundles multiple flights into a single pricing/itinerary, forcing you to book the full itinerary rather than an individual segment.
How does it control award pricing? The following example will help you understand:
| Scenario | BOS-ORD | ORD-NRT | Total miles (saver) | Availability |
| Standalone BOS-ORD | I0 | – | N/A | Blocked |
| Standalone ORD-NRT | – | I0 | N/A | Blocked |
| Married BOS-ORD-NRT | I4 | I4 | 88k | Open as one award |
Here, the airline releases saver space (I class business) on the complete chain BOS-ORD-NRT, and not for standalone. This protects short-haul revenue while filling long-haul connections.
Strategic search can unlock hidden saver space like these through multi-city itineraries. Quit the endless searching of forced connections for award availability and simplify your award travel with Flightpoints.
Part 5: Timing Patterns and How They Affect Award Pricing
As discussed in the above sections, Award availability does not simply appear. It moves in response to revenue forecasts. And because modern US programs use dynamic pricing alongside saver buckets, the timing of release directly impacts mileage cost.
Timing affects pricing in three major ways:
- Whether saver pricing exists at all
- Whether only dynamic pricing remains
- How aggressively dynamic algorithms price remaining inventories
Let’s break it down.
Scheduled Opening (330 days out)
When airlines load schedules (typically around 330 days before), revenue management systems can only forecast with limited booking data. Because uncertainty is high at this stage, airlines sometimes release a small number of saver seats automatically.
How this affects pricing
If saver buckets (like X or I) are opened at schedule load:
- You may see it at the lowest-level pricing
- Partner programs can access those seats
- Pricing reflects baseline award levels
However, dynamic pricing engines are also active during this time.
If the route is projected to be high-demand (especially at peak travel times), the system may:
- Release zero savers
- Price awards dynamically at elevated mileage levels
- Increase premium cabin pricing significantly
So, at schedule opening, pricing is decided around forecasted demand, not the real demand. This means that some routes are cheapest at 330 days, but others are already expensive because the system expects strong demand.
Mid-Cycle Adjustments (2-5 months out)
As real bookings start to come in, airlines compare actual sales against forecasts. If bookings are weaker than expected:
- Revenue buckets may be adjusted downward.
- Award saver buckets may open.
- Dynamic pricing curves may flatten.
How this affects pricing:
Mid-cycle adjustment is one of the most misunderstood periods. Because when saver inventory opens mid-cycle:
- Pricing can suddenly drop from 90,000 miles to 60,000 miles in business class.
- Partner programs suddenly gain access to inventory.
- Mileage cost suddenly becomes predictable.
This is the case of saver inventory. The same thing could happen for dynamic pricing as well. Dynamic pricing is demand sensitive. In dynamic-only situations, pricing may still decrease if cash fares fall, load factors remain low, or because of competitor pricing. This is why pricing sometimes decreases months after initial release.
Last-Minute Releases (1-14 days before departure)
As departure approaches, the revenue management faces a critical decision:
- Sell the remaining premium seats at discounted cash fares?
Or
- Release saver awards to reduce mileage liability?
If premium seats are likely to go unsold, airlines may release saver buckets late.
How this affects pricing:
This situation during last-minute releases can cause dramatic mileage price drops.
For example, a business class priced at 120,000 miles might drop to 60,000-70,000 miles 7 days before departure when saver class opens.
This is because the opportunity cost of the seat changes (according to revenue management data). If the seat is unlikely to sell for $4,000, releasing it for miles becomes rational.
However, on business-heavy routes (like New York-London or San Francisco-Tokyo):
- Corporate contracts fill late-booking premium seats
- Revenue expectation remain high
- Saver buckets stay closed
- Dynamic pricing remains elevated
Yes, pricing may look uncertain by now. But last-minute pricing behaviour is entirely dependent on projected revenue salvage value.
| Timing Stage | Saver Availability Likelihood | Dynamic Pricing Behaviour |
| Schedule opening | Moderate (depends on route) | Based on forecasted demand |
| Mid-cycle weak demand | Increased | Pricing may decrease |
| Late strong demand | Rare | Pricing spikes |
| Last-minute unsold premium | Possible | Pricing may drop sharply |
Timing shifts the airline’s perceived revenue risk, and award pricing reflects this risk.
Why Timing Matters More in Dynamic Pricing
Under fixed award charts, timing only affects availability. However, under dynamic pricing timing affects both availability and mileage cost. This is because the system continuously recalculates the projected revenue.
Let’s look into different scenarios to understand how and why certain timing and demands affect pricing.
Scenario 1: Weak demand: Price drops over time
This scenario shows a flight that underperforms initial expectations.
| Time before departure | Demand forecast | Saver bucket status | Dynamic price for business class | What actually happens internally |
| 300 days | Strong projected demand | Closed | 95,000 miles | Protects seats because system expects high revenue |
| 120 days | Bookings weaker than forecast | Opens | 60,000 miles | Saver space releases because revenue risk increases |
| 5 days | Premium cabin still unsold | Additional saver seats open | 55,000-60,000 miles | Airline prioritizes filling seats over protecting yield |
Here, early pricing was based on positive demand projections. As real bookings lagged, the opportunity of cost releasing award seats decreased. And dynamic pricing adjusted downward once the saver inventory opened.
Scenario 2: Strong Demand: Pricing Increases Over Time
This example shows a flight that performs better than expected.
| Time before departure | Demand forecast | Saver bucket status | Dynamic price for business class | What actually happens internally |
| 300 days | Moderate forecast | Saver available | 60,000 miles | Baseline saver seats loaded at schedule opening |
| 120 days | Strong bookings | Saver closes | 120,000 miles | Airlines protect remaining seats for cash sales |
| 5 days | Premium cabin nearly full | No saver space | 140,000+ miles | Pricing spikes during last-minute demand |
Here, early saver seats were available when uncertainty was high. Then as bookings exceeded expectations, the airline closed saver inventory and pricing went upward to reflect strong demand and late corporate bookings.
This demonstrates that pricing is not fixed at schedule load. Award costs evolve as revenue confidence changes. Saver bucket openings create sudden price drops and saver closures create sudden price hikes.
Side-by-Side Comparison of Strong and Weak Demand Changing Pricing
| Stage | Weak Demand Flight | Strong Demand Flight |
| Schedule opening | High dynamic price | Saver pricing available |
| Mid-cycle | Saver opens, price drops | Saver closes, price jumps |
| Last-minute | Additional saver space | Pricing spikes further |
Part 6: Distance-Based vs Region-Based Pricing
Not all award pricing models are built the same. The structure an airline chooses determines how mileage cost is calculated before dynamic adjustments begin. These structures are: distance-based and region-based.
This structural choice influences:
- Baseline award pricing
- Sweet spots
- Penalties for long routes
- Pricing consistency
This pricing model is the foundation on top of which dynamic pricing operates.
Let’s take a closer look into both structures.
Region-Based Pricing
Region-based pricing assigns a fixed or semi-fixed mileage price between two geographic zones, regardless of exact distance. For example, a flight from New York to London and a flight from Dallas to Rome may cost the same.
Region-based pricing creates flat “price ceilings” per region pair. Which means that shorter flights within a region can be overpriced. And longer flights within the same region can be underpriced. To understand clearly, here’s an example:
A flight from Boston to Dublin (short transatlantic) may cost the same as Los Angeles to Athens (longer flight). This is what creates sweet spots on long-haul routes.
In region-based systems, airlines decide pricing primarily based on:
- Market demand between regions
- Historical pricing benchmarks
- Competitive positioning
Distance is secondary here. However, when dynamic pricing is layered on top (as with American Airlines and United Airlines for their own flights), region-based logic becomes more flexible. The region sets a reference band, but dynamic adjustments can push pricing above or below normal pricing.
Distance-Based Pricing
Distance-based pricing calculates mileage cost based on the total miles flown. The longer the flight, the more miles required. Here, distance becomes the primary pricing variable. This means:
- Longer nonstop flights cost more.
- Connecting itineraries may cost more if total distance increases.
- Ultra-long haul routes are expensive by design.
Distance-based pricing is predictable because it follows a mileage band structure. But, this model penalizes long-haul nonstop routes. For example, a 7,000 mile nonstop flight automatically falls into a high band even if demand is weak. The base price will anyways start high.
Now let’s connect these structures to dynamic pricing behaviour.
Structural Impact on Dynamic Pricing
In region-based systems dynamic pricing modifies a region’s baseline. For example, let’s say a US to Europe business saver costs 60,000 miles. Here, the dynamic pricing may move between 55,000 and 120,000 miles.
In distance-based systems dynamic pricing modifies a distance band. Longer flights start at a higher baseline. This means that dynamic spikes can push already high prices even higher and short haul flights remain affordable.
As we’ve seen, structure determines the starting point for pricing volatility. But then which benefits travelers the most? Let’s analyze:
Which Model Favors Travellers?
The best pricing model depends on your travel style. Here’s a simplified pros and cons of each model. This will help you streamline your award travel decision making.
Region-based advantages:
- Better for long haul flights.
- Creates sweet spots.
- Easier to understand geographically.
Region-based disadvantages:
- Can overprice short flights.
- Dynamic overlays reduce predictability.
Distance-based advantages:
- Transparent pricing math.
- Fairer pricing for short routes.
- Logical scaling.
Distance-based disadvantages:
- Punishes ultra-long hauls.
- Can eliminate sweet spots.
Airlines choose a model based on revenue strategy. In dynamic systems, both models increasingly blend.
| Region-Based Pricing | Distance-Based Pricing |
| Simpler to market and communicate. | More mathematically precise. |
| Historically aligned with alliance zone maps. | Aligns pricing more closely with operating costs. |
| Allows controlled sweet spots to drive loyalty engagement. | Reduces extreme arbitrage opportunities. |
Real examples include,
United Airlines and Delta Air Lines have moved toward hybrid dynamic systems.
Alaska Airlines still uses distance-style logic for certain partner awards.
American Airlines maintains region-based partner charts but dynamically prices down its own flights.
Understanding this pricing system will help travellers take strategic steps towards award travel. It helps you decide:
- When to prioritize long-haul premium redemptions.
- When short-haul cash fares may be smarter.
- When connecting flights might price differently.
- When a partner program might price the same flight cheaper due to different structure.
Pricing structure is not just a technical design, it determines high value redemption opportunities. And value opportunities determine strategy.
Unlock strategic redemption plans for the best award travel experiences through Flightpoints.
Part 7: Partner Award Pricing Differences-How This Directly Affects Award Pricing
Partner awards operate under a different pricing logic than an airline’s own dynamically priced flights. When you book a partner airline using miles from Star Alliance, Oneworld, and SkyTeam, the pricing structure is usually determined by different charts:
- A region-based chart
- A distance-based chart
- Or a partner-specific award table
Dynamic pricing generally does not apply to partner awards. This structural difference directly affects how much you pay in miles.
When you book through an airline’s own flight, miles change based on demand (dynamic pricing). But, partner flights are chart-based or semi-fixed pricing. Also, partner bookings require saver-level availability. Yes, booking through partners is cheap, but it has only limited availability.
A simple comparison:
| Feature | Own Flights | Partner Flights |
| Pricing | Dynamic | Fixed/Chart-based |
| Mileage Changes | Yes | Rarely |
| Saver Required | No | Yes |
| Predictability | Low | Higher |
Dynamic prices can jump very high. Partner awards often stay at stable mileage levels. This can make partner awards cheaper, only if saver seats are available.
This covers the basic factors that determine airline award pricing. Understanding them unlocks strategic redemptions that separate casual searchers from consistent award winners. Checkout Flightpoints-the fastest award search tool delivering real-time, filtered results across 10+ programs.
Now let’s analyze some practical pricing techniques that can be used for redemptions and why they matter.
Part 8: Evaluating Redemption Value
It is always better to compare miles with cash before redeeming. You can use this formula to understand the mile’s value:
Cash price ÷ Miles required = Value per mile
Example:
Cash price Miles Value
$250 20,000 1.25 Cents
$800 60,000 1.33 Cents
$1,500 70,000 2.14 Cents
High-value redemptions usually occur when saver pricing exists and cash fares are high.
Part 9: Why Devaluations Happen
Devaluations occur due to:
- Mileage inflation
- Increased credit card issuance
- Rising premium demand
- Shift towards revenue-based models
Dynamic pricing allows “silent devaluations” without formal chart announcements.
There exists misconceptions among travellers. Make sure to not fall for them.
Common Myths:
- Empty seat map = award availability.
- Early booking guarantees saver space.
- High cash fare always equals high mileage price.
- More miles in your account increases availability.
Know this: availability depends on bucket control.
Avoid missing great opportunities or wasting miles on low-value redemptions. Always compare availability across programs and partners before transferring points. Tools like Flightpoints help navigate the best redemption options efficiently.
Conclusion
Airline award pricing has evolved from simple fixed charts to complex, revenue-driven systems. Today, most major U.S. carriers use dynamic pricing for their own flights, meaning mileage costs fluctuate based on demand, timing, and expected cash revenue. At the same time, partner awards often follow more stable chart-based pricing, creating opportunities when saver space is available.
Understanding how airlines manage inventory, release award space, and adjust pricing over time transforms the way you approach award travel. Instead of viewing mileage prices as random, you begin to see the logic behind them. The more you understand these systems, the better you recognize value, avoid inflated redemptions, and maximize points strategically.
Join Flightpoints to explore the best redemption plans.
Become a pro user and get 44% off your subscription to start your premium award travel experience.
FAQs
Q: Why do award prices change so often?
Most U.S. airlines now use dynamic pricing, which means mileage costs adjust based on demand, booking trends, and projected cash revenue. If a flight is selling well, the mileage price usually increases. If demand is weak, the airline may lower the mileage cost or release saver space.
Q: What is a saver award space?
Saver space is limited award inventory offered at the lowest mileage level. These seats are capacity-controlled and may disappear quickly on popular routes. Partner bookings usually require saver availability to be accessible.
Q: Is it better to book early or last minute?
Booking early can help you secure initial saver releases, especially on premium international routes. However, some airlines release additional seats closer to departure if flights are not selling well. The best timing depends on demand patterns and the airline’s revenue strategy.
Q: Why are partner awards sometimes cheaper?
Partner awards often follow semi-fixed or chart-based pricing instead of dynamic pricing. This can create stable mileage rates even when the operating airline’s own flight is pricing high. However, you must find saver-level availability to access these lower rates.
Q: Do award charts still exist?
Some programs have removed public award charts for their own flights but still use structured internal pricing logic. Many airlines maintain separate charts for partner awards. Even without published charts, pricing still follows revenue-based rules.
Q: Can award prices drop after I book?
Yes, especially under dynamic pricing systems. If demand weakens, mileage rates may decrease before departure. Some programs allow free cancellations or redeposit of miles, letting you rebook at a lower price if available.